JOINTS 2023;
1: e167
DOI: 10.26355/joints_20234_167
Consistency of differentially expressed genes in the subchondral bone of end-stage osteoarthritic knees
Topic: Knee
Category: Original article
Abstract
Objective: Subchondral bone (SB) is one of the important tissues in development and progression of osteoarthritis (OA). To identify genes involved in the disease process, comprehensive gene expression analysis of SB was performed.Patients and Methods: Medial dominant knee OA patients were selected, and SB of the medial femoral condyle (MFC) and lateral femoral condyle (LFC) was collected at the time of total knee arthroplasty. After RNA extraction, gene expression levels were compared between the MFC and LFC using microarrays. Genes that changed more than two-fold in the MFC were compared with the previously reported gene list from the same type of study that used the affected tibial plateau. Pathway analysis and immuno-histochemical analysis of selected molecules were performed.
Results: Eighty genes were identified as commonly affected genes in both the present study and a previous study. Among them periostin was conspicuously up-regulated. Pathway analysis revealed up-regulated osteoclast activities. Periostin was detected in the cytoplasm of mononuclear cells in the SB, except for osteocytes.
Conclusions: Among the 80 genes detected and thought to be important, periostin was the most highly up-regulated. Its importance in OA pathogenesis is indicated.
Key words: Gene expression, Knee osteoarthritis, Subchondral bone, Periostin, Osteoclast.
Introduction
The development and progression of osteoarthritis of the knee (KOA) involves every joint tissue1. The importance of subchondral bone (SB) has been reported2. SB thickening, upregulated angiogenesis, and bone marrow tissue invasion into SB and calcified cartilage are well-documented and characteristic events accompanying OA development3-6. This invasion occurs through bone resorption and creates resorption pits3,4,7. There is a close relationship between symptoms and pathological changes in the SB2,6. Ogino et al6 detected up-regulated pain-related molecules in SB of the medial femoral condyle (MFC) in medial compartment dominant KOA by immunochemical analysis. Ochiai et al8 reported that pathological changes in the MFC detected with MRI were correlated to pain or other symptoms of OA.
Gene expression patterns of cells that reside in SB might be affected during OA development. To identify genes involved in the disease process, Chou et al9 employed microarray analysis on specimens obtained at total knee arthroplasty. They found 972 genes that were differentially expressed in significantly degenerated SB of the medial tibial plateau compared to the minimally degenerated lateral tibial plateau. The relative difficulty in extracting RNA from hard tissue might account for the fact that this is the only comprehensive gene expression study of SB from the human knee9.
To confirm important genes among these 972 genes, we performed a similar experiment using our sample derived at the time of total knee arthroplasty (TKA) but used the femoral condyle that has been our focus of study. The aim of the present study was to detect genes in SB that the femoral condyle and tibial plateau have in common that could play important roles in OA development.
Patients and Methods
Patients
Medial-type KOA patients who underwent TKA at our institution were included in this study. All participants were Japanese. The medial compartment of knees that were grade IV on the Kellgren and Lawrence scale (K/L) were selected and compared to the minimally affected lateral compartment that was grade 0 or I on the K/L scale as well as no bone marrow lesions (BML) on MRI10. At the time of surgery, the patient’s age, as well as X-ray image grading of the medial and lateral tibio-femoral joints and MRI to detect BMLs in each compartment were recorded. Twelve knees met the above criteria during the study period. The first four knees were selected for microarray analysis to compare the gene expression pattern of less degenerated SB (lateral femoral condyle: LFC) and highly degenerated SB (medial femoral condyle: MFC). The subsequent eight knees were used for immunohistochemical analysis. Patients with other arthritic diseases such as rheumatoid arthritis were excluded from the study. The study protocol was approved by the institutional Ethics Committee of our institute in 2007, and thereafter the continuance of the study was approved following an annual report and re-assessment. Written informed consent was obtained from all the patients. The study was conducted in accordance with the declaration of Helsinki.
X-ray and MR Imaging
A standard A-P x-ray was used to determine the K/L score for the medial and lateral compartments. Using MRI (Signa 1.5T, GE Medical Systems), we assessed sagittal and coronal fat suppressed T2-weighted images (TR 2,000 ms, TE 87 ms, field of view 13 x 13 cm, matrix 512 ´ 256, and 3 mm slice thickness with a 1 mm inter-slice gap) to detect the location of BMLs in the affected knees.
Specimens
The weight-bearing areas of the MFC and LFC were obtained at the time of TKA (Figure 1). Osteophytes and remaining cartilage were excised, and SB was cut into small pieces with a bone rongeur, immediately frozen with liquid nitrogen and stored at -80 degrees for further study.
Figure 1. Gross appearance of specimen. The gross appearance of a knee joint used in this study is shown. Open arrows identify the medial femoral condyle (MFC) with a large peripheral osteophyte and denuded bone in the center. Arrowheads indicate the lateral femoral condyle (LFC) with a glassy appearance of the cartilage. P: patella.

Microarray
Specimens were crushed with a mortar and pestle under liquid nitrogen to create a powder. They were further ground with the addition of Qiazol (1 ml/100 mg of tissue). Each milliliter of mixture was transferred to a 1.5 ml plastic tube on ice, then vortexed and left at room temperature for two minutes. They were centrifuged (11,000/rpm for four minutes) and the aqueous phase was transferred to a fresh 1.5 ml tube. Then 200 ml of chloroform were added, vigorously mixed for 15 seconds, and left at room temperature for two minutes. This was then centrifuged (11,000/rpm for four minutes) and the aqueous phase was transferred to a fresh 1.5 ml tube. The equivalent volume of 70% ethanol was added and vortexed. The 700 ml mixture was added to the RNeasy Mini Spin Column (QiagenTM, Hilden, Germany). The quality of RNAs was confirmed by electrophoresis with the Agilent 2100 Bioanalyzer (Agilent, Santa Clara, USA). Four sets of micro-array comparisons between the subchondral bone of the MFC and the LFC were performed using Human Genome U133 Plus2.0 (GeneChip®, Affymetrix, Affymetrix, Inc., Santa Clara, CA, USA). Genes that exhibited no less than a two-fold change (p≤0.05) were identified using Avadis software (version 4.3, Strand Life Sciences Pvt. Ltd, India) and their overall expression patterns were presented as a heat map. They were compared with the results of the previous analysis by Chou et al9. Common genes between the two studies were selected.
Pathway Analysis
Selected genes were uploaded to Ingenuity Pathway Analysis (IPA®, Qiagen, The Netherlands) to identify functional relationships. We used the Fisher’s exact test to discover relationships between sets of genes, pathways, and functions.
Immuno-Histochemistry
Weight-bearing areas of the MFC and the LFC were obtained by a distal cut of the femur at the time of TKA. Specimens were cut immediately into slabs of 5-6 mm thickness in the sagittal direction with a chisel. Specimens were fixed in 4% paraformaldehyde in phosphate-buffered saline (PBS) for 24 hours, followed by 6 weeks of demineralization in 20% ethylenediaminetetraacetic acid (EDTA) at room temperature (RT). They were embedded in paraffin and sagittal sections (6 mm) were cut and mounted on glass slides. The sections were deparaffinized using 80% xylene and ethyl alcohol, rinsed with PBS (pH 7.6). They were treated with 0.3% H2O2 for 15 minutes at RT and washed with PBS (pH 7.6) three times. Anti-Human Periostin Rabbit polyclonal antibody (#ab14041, Abcam Japan, Tokyo, Japan) was diluted by x104 and applied onto the slides at 4°C overnight and subsequently washed with PBS (pH 7.6) three times. Biotin labelled anti-IgG antibody (DAKO#K0675, Agilent, Santa Clare, CA, USA) was applied for 10 minutes at RT and specimens were washed with PBS (pH 7.6) three times. Then 3‐3`‐Diaminobezidine‐4HCl (DAB) was applied for 5 minutes at RT.
Mayer hematoxylin was used for nuclear staining.
Results
Patients
The average age of patients was 72.2±4.2 years old (mean±standard deviation). Ten patients were female and two were male. The first four specimens used for the array study were females aged 69-72. The following eight specimens included six females and two males aged 65-80.
Microarray
A total of 555 genes were detected; 269 were down-regulated and 286 were up-regulated. Heat map analysis showed consistent results among the initial four samples (Figure 2). Among them, the top 20 up-regulated or down-regulated genes were listed (Table 1).
Figure 2. Dendrogram of specimens analyzed by microarray. Dendrogram shows mostly consistent results among the four specimens.
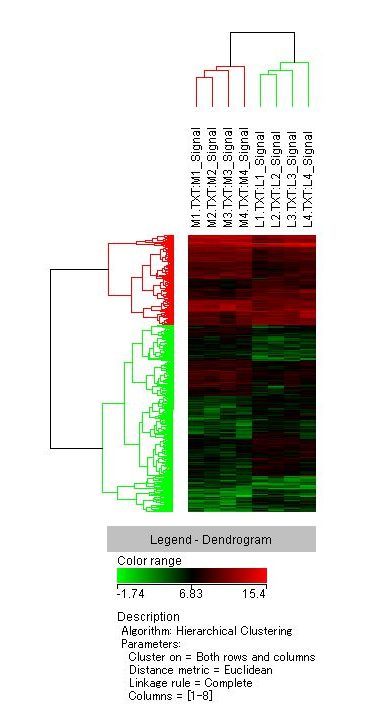
Table 1. Top 20 gene lists of higher fold changes. Genes that exhibited the highest and lowest fold changes are listed. Twenty genes that exhibited the highest fold changes in the medial femoral condyle are shown in the upper box and 20 with the lowest fold changes are in the lower box.
|
Gene Symbol |
Gene Title | Fold change | p-value |
| APCDD1L | adenomatosis polyposis coli down-regulated 1-like | 16.57 | 1.28E-03 |
| STMN2 | stathmin-like 2 | 15.51 | 4.31E-02 |
| POSTN | periostin, osteoblast specific factor | 12.12 | 4.67E-02 |
| STMN2 | stathmin-like 2 | 10.05 | 7.89E-03 |
| LHX2 | LIM homeobox 2 | 9.05 | 2.95E-02 |
| ABCB5 | ATP-binding cassette, sub-family B (MDR/TAP), member 5 | 8.47 | 1.21E-02 |
| REL | v-rel reticuloendotheliosis viral oncogene homolog (avian) | 7.65 | 4.12E-02 |
| ACSL6 | Acyl-CoA synthetase long-chain family member 6 | 7.35 | 1.69E-03 |
| CCL18 | chemokine (C-C motif) ligand 18 (pulmonary and activation-regulated) | 5.95 | 1.58E-02 |
| C6orf150 | chromosome 6 open reading frame 150 | 5.81 | 1.40E-02 |
| LOC255480 | hypothetical protein LOC255480 | 5.67 | 3.35E-02 |
| PCDHB8 | protocadherin beta 8 | 5.50 | 4.30E-02 |
| TIMD4 | T-cell immunoglobulin and mucin domain containing 4 | 5.50 | 2.63E-02 |
| ARPC4 | actin related protein 2/3 complex, subunit 4, 20kDa | 5.43 | 1.84E-02 |
| NUP210L | nucleoporin 210kDa-like | 5.00 | 5.76E-03 |
| B4GALT1 | UDP-Gal:betaGlcNAc beta 1,4- galactosyltransferase, polypeptide 1 | 4.88 | 4.74E-02 |
| PPP3R2 | protein phosphatase 3 (formerly 2B), regulatory subunit B, beta isoform | 4.66 | 3.63E-02 |
| PLA2G7 | phospholipase A2, group VII (platelet-activating factor acetylhydrolase, plasma) | 4.65 | 4.96E-02 |
| GBP6 | guanylate binding protein family, member 6 | 4.54 | 2.67E-02 |
| RAB27B | RAB27B, member RAS oncogene family | 4.28 | 2.16E-02 |
| STXBP5L | syntaxin binding protein 5-like | -4.82 | 8.43E-03 |
| EMILIN3 | elastin microfibril interfacer 3 | -5.07 | 3.38E-02 |
| CYLC2 | cylicin, basic protein of sperm head cytoskeleton 2 | -5.15 | 3.33E-02 |
| NAT2 | N-acetyltransferase 2 (arylamine N-acetyltransferase) | -5.26 | 4.48E-02 |
| IQCA | IQ motif containing with AAA domain | -5.33 | 4.83E-03 |
| MAL2 | mal, T-cell differentiation protein 2 | -5.51 | 3.47E-02 |
| SLC14A1 | Solute carrier family 14 (urea transporter), member 1 (Kidd blood group) | -5.66 | 8.69E-03 |
| CCT8 | chaperonin containing TCP1, subunit 8 (theta) | -6.01 | 3.72E-02 |
| KBTBD2 | kelch repeat and BTB (POZ) domain containing 2 | -6.28 | 1.73E-02 |
| TNKS2 | Tankyrase, TRF1-interacting ankyrin-related ADP-ribose polymerase 2 | -6.32 | 4.45E-02 |
| RAB11FIP4 | RAB11 family interacting protein 4 (class II) | -6.53 | 1.14E-02 |
| MAOB | monoamine oxidase B | -6.55 | 4.52E-02 |
| KCNA6 | potassium voltage-gated channel, shaker-related subfamily, member 6 | -6.96 | 4.87E-02 |
| C4orf10 | chromosome 4 open reading frame 10 | -7.81 | 4.63E-02 |
| LOC400581 | GRB2-related adaptor protein-like | -8.52 | 4.95E-02 |
| C1orf168 | chromosome 1 open reading frame 168 | -8.91 | 1.73E-02 |
| GLB1L3 | galactosidase, beta 1 like 3 | -9.46 | 1.64E-02 |
| RELN | Reelin | -9.74 | 3.06E-02 |
| ACPP | Acid phosphatase, prostate | -9.99 | 9.32E-07 |
| SPOCK3 | sparc/osteonectin, cwcv and kazal-like domains proteoglycan (testican) 3 | -17.96 |
9.25E-03 |
M1-M4: MFC of specimen number 1 to 4, L1-L4: LFC of specimen number 1 to 4.
After comparison with the previously published data, 83 genes were found to be common in the two studies. Only three genes were differentially selected (C8orf46 was up-regulated in our study but down-regulated in Chou et al9 study; KIAA1549 and CILP2 were vice versa). As a result, 41 genes in common were down-regulated and 39 genes in common were up-regulated (Table 1). Periostin was the third most up-regulated gene in our experiment and the second most in Chou et al9 study and was the top up-regulated gene in common to both studies. CCL18 was the 9th most up-regulated in our experiment and 18th in Chou et al9 study. These two genes were conspicuous among the up-regulated genes with higher fold changes. Among the down-regulated genes there were no conspicuous common genes. Even MAOB, which was the most down-regulated of the common genes, was ranked lower than 100th in both studies.
Table 2. Genes detected by both the present study and Chou et al9. Genes were sorted in terms of fold change. Pale blue denotes down-regulated genes in both studies and pink denotes up-regulated genes. The uncolored boxes denote genes that were differently up-regulated or down-regulated in the two studies.
| OA-MFC vs. OA-LFC | OA-MT vs. OA-LT | |
| Present study | Previous study | |
| Gene Symbol | Fold change (log) | Fold change (log) |
| MAOB | -6.5533977 | -4.863871 |
| SLC14A1 | -5.6625037 | -2.1509938 |
| MAL2 | -5.5120673 | -3.9298732 |
| SERPINA11 | -4.235943 | -2.119034 |
| TUBB2B | -4.1956835 | -3.4588885 |
| FRZB | -4.1759686 | -3.6895998 |
| ADRB1 | -4.147265 | -6.24876 |
| PLEKHA6 | -3.5258596 | -6.747841 |
| MAST4 | -3.438534 | -2.347014 |
| ITIH5 | -3.2449696 | -4.8430476 |
| C6orf141 | -3.2042685 | -2.4087913 |
| NPAS3 | -3.1428895 | -2.2713976 |
| ALPK3 | -3.1365645 | -2.9044218 |
| PHACTR3 | -3.074812 | -2.499774 |
| CP | -3.0716498 | -2.4937148 |
| GPX3 | -3.0692692 | -3.0644202 |
| CILP2 | -3.0683725 | 2.2023702 |
| FLJ30901 | -3.0016868 | -2.4889617 |
| SPON1 | -2.8833199 | -4.132811 |
| CPAMD8 | -2.8407679 | -2.5941923 |
| BMP5 | -2.812929 | -2.1320634 |
| NR3C2 | -2.8100128 | -2.023899 |
| C3orf15 | -2.6992748 | -2.7853613 |
| LRIG1 | -2.6804972 | -3.3472672 |
| GPR88 | -2.6323795 | -3.62568 |
| STEAP2 | -2.427019 | -2.0595708 |
| CX3CR1 | -2.4225044 | -2.0528212 |
| C5orf4 | -2.372651 | -2.0547688 |
| SLITRK4 | -2.2919903 | -2.4348314 |
| LOC286367 | -2.2799702 | -3.154291 |
| LOC283481 | -2.2767096 | -2.027693 |
| FREM1 | -2.1542118 | -4.8132205 |
| HOOK2 | -2.1512113 | -2.720375 |
| NTRK2 | -2.1380017 | -6.1328216 |
| PLCD4 | -2.1368754 | -2.2452905 |
| RNF157 | -2.1342144 | -3.223631 |
| ABCA5 | -2.1060994 | -2.0572698 |
| EPB41L1 | -2.1036937 | -2.4675355 |
| KIAA1549 | -2.0877533 | 2.0662715 |
| CALB2 | -2.0794773 | -2.6424754 |
| AIFM2 | -2.072843 | -2.413659 |
| HLF | -2.0654597 | -2.2955666 |
| HOXA3 | -2.0459368 | -2.056691 |
| CENPN | 2.0115683 | 2.062049 |
| PARD6G | 2.033204 | 2.1521852 |
| C8orf46 | 2.045139 | -2.2831445 |
| C5orf13 | 2.0452323 | 2.0739815 |
| ACTG2 | 2.048137 | 2.4345725 |
| TNFSF11 | 2.0558972 | 4.34127 |
| CCDC102B | 2.080242 | 2.4713972 |
| HTRA3 | 2.1331067 | 2.2677412 |
| CDKN3 | 2.1379535 | 2.9774113 |
| MSX1 | 2.164112 | 2.220943 |
| LRRC17 | 2.1842315 | 2.906174 |
| COL3A1 | 2.188848 | 7.3288226 |
| CDCA3 | 2.2920735 | 2.2213311 |
| CHN1 | 2.2949922 | 2.0775485 |
| TYMS | 2.3282444 | 3.1757321 |
| SCARA5 | 2.424889 | 3.332766 |
| C20orf103 | 2.4346523 | 3.4417813 |
| TPSAB1 | 2.456534 | 3.6560278 |
| LRRC8E | 2.4710991 | 3.8735626 |
| SRPX | 2.5169666 | 2.5313623 |
| FAM19A5 | 2.5376523 | 2.8747823 |
| NXN | 2.5811422 | 2.5387168 |
| PLAUR | 2.6765716 | 2.0245788 |
| MMP14 | 2.688838 | 2.197969 |
| COL12A1 | 2.703213 | 2.0333421 |
| TGFBI | 2.7579374 | 2.7628796 |
| COL16A1 | 2.8061037 | 2.8121047 |
| S100A3 | 2.8506804 | 2.98722 |
| TNFRSF12 (RANK) | 2.9320805 | 2.5589716 |
| CD276 | 3.06419 | 2.3399854 |
| INHBA | 3.165559 | 3.6538355 |
| GALNT5 | 3.4298587 | 3.077467 |
| COL6A1 | 3.7561185 | 2.3626168 |
| THY1 (CD90) | 3.7700238 | 4.273056 |
| TMEM200A | 3.7810676 | 2.8038828 |
| SPOCD1 | 3.9896536 | 2.6428993 |
| ATP6V0D2 | 3.9936433 | 2.4144168 |
| PRSS23 | 4.25729 | 3.3654542 |
| CCL18 | 5.946216 | 6.2267637 |
| POSTN | 12.124958 | 15.650212 |
Pathway Analysis
Using the above 80 genes, RANK signaling in osteoclasts was derived by pathway analysis. Specifically, TNFRSF12 (RANK), TNFSF11 (RANKL), and POSTN were selected for the pathway for “bone resorption by osteoclasts” (Figure 3). The other genes were not selected.
Figure 3. Pathway analysis. Osteoclast-related pathways were retrieved by pathway analysis. Specifically, bone resorption by osteoclasts was retrieved with inclusion of RANKL, RANK, and POSTN. Numbers indicate fold changes on top and p-value below. Three to four probes at different gene positions were used in the microarray analysis, resulting in multiple values for RANKL, RANK, and POSTN.

Immuno-Histochemistry
Periostin was detected in the SB and bone marrow of the MFC but not in the LFC. It was located in the cytoplasm and the peri-cellular area of multi-nucleated cells, lining cells in bone resorption pits, and vascular epithelial cells but not in the mature bone matrix (Figure 4).
Figure 4. Immuno-histochemical analysis of periostin. Immunohistochemical analysis revealed absence of periostin in cartilage and subchondral bone of LFC (A) but abundant periostin in MFC (B). Cells positive for periostin were assumed to be osteoclast, osteoblast, and vascular endothelial cells but not osteocytes.

Discussion
In the present study, we found 555 genes with altered expression levels in SB of severely damaged MFC compared to LFC. Among them, 80 genes were in common with the study of Chou et al9. We considered these 80 genes important for further study because they were identified repeatedly in a similar age group (72.2±4.2 years old vs. 69.65±9.55 years old) but in different tissues (femoral condyle vs. tibial plateau), and from patients with different ethnic backgrounds (Japan vs. Taiwan).
Periostin
Periostin was the most highly up-regulated gene in common between the two studies. It also was reported to be one of the most highly expressed genes in the medial compartment of the knee in a surgically-created mouse OA model11, which indicated the involvement of periostin in the development of OA beyond species. Attur et al12 reported that systemic disruption of periostin exhibited less osteoarthritic changes both in the destabilization of the medial meniscus (DMM) model, as well as in the aging model in mice. Jacobs et al13 reported up-regulated periostin in joint fluid of the knees after anterior cruciate ligament reconstruction and concluded that periostin might be a biomarker for early cartilage degradation.
Periostin is known as a component of extracellular matrix (ECM), but immunohistochemical analysis revealed the main location of periostin in the SB was cytoplasm and the peri-cellular area of cells in bone resorption pits and in multi-nucleated cells but not in mature bone matrix. The cells in bone resorption pits were presumably osteoblasts, pre-osteoclasts, and vascular endothelial cells but not osteocytes (Figure 4). To confirm more clearly which cells express periostin, additional immuno-histochemical analysis might be required, but cell morphology and location are important clues. Morphologically, cells in bone resorption pits are divided into mononuclear cells, multi-nuclear cells, and lining cells, but the characteristics of these cells are not simple. Ogino et al6 have reported mononuclear cells were either vascular endothelial cells or osteoblasts using immuno-histochemical analysis of CD 34. Shibakawa et al4 showed that multinucleated cells could be divided by vitronectin receptor alpha (VNR-a), MMP 1, 3, and 13 positivity. They also showed smaller mononuclear cells could be divided by MMP 1, 3, and 13 positivity.
A variety of cells are known to express periostin, i.e., osteoblasts, osteocytes, osteoclasts, vascular endothelial cells, and mesenchymal stem cells (MSCs)14-16. Potentially, every type of cell expresses periostin, but the absence of its expression in osteocytes remains to be proven. Unfortunately, we could not demonstrate that in this study.
Interestingly, mechanical stress, which is thought to be the main cause leading to OA development, induced periostin expression in several types of cells17,18. Zhang et al18 reported that running increased periostin expression in mouse osteoblasts. Bonnet et al19 reported that periostin promoted osteoblast differentiation. Gerbaix et al20 cited the importance of periostin in mechanical stress-induced osteoclastogenesis. Our results indicated that up-regulated periostin in osteoblasts and osteoclasts by mechanical stimuli promoted both bone formation and resorption, which caused the abnormal changes of subchondral bone observed in OA.
Periostin was detected in degenerated cartilage as well. Chijimatus et al21 reported detection in the cytoplasm of clustered chondrocytes and peripheral cartilage matrix. Mechanical stimuli on cartilage might induce periostin but a recent study16 revealed the existence of several isoforms of this molecule. Thus, we cannot tell whether SB and cartilage periostin are the same. The antibody used in the present study was against the N-terminal of periostin, which is common for all isoforms.
Gender did not appear to affect the periostin expression of SB. Although we had only two male participants, they exhibited the same pattern as female participants immuno-histochemically.
Osteoclast Pathway
Pathway analysis produced only a single network related to osteoclast activities due to highly elevated RANKL, RANK, and TRAF6 (Figure 3). This might be due to the restricted number of genes (n=80) but it highlights the importance of this pathway in SB of OA. Tat et al22 reported a subpopulation of osteoblasts that had lower prostaglandin E2 in the SB in OA joints that produced RANKL and enhanced osteoclast differentiation. Martinez-Calatrava et al23 reported that RANKL synthesized by chondrocytes stimulated osteoclast activities of SB in an animal model. The importance of TRAF6 in osteoclast formation and function has been established24. Although periostin was detected in this pathway (Figure 3), its importance in bone resorption is not clear. Interestingly, angiogenesis that occurs along with bone resorption was reported to be promoted by periostin25. Hu et al26 reported that osteoblast-derived vascular endothelial growth factor (VEGF) stimulated osteoclast formation, which is one plausible explanation for the coupling of angiogenesis and bone resorption. On the other hand, Saito et al5 revealed that angiogenesis was up-regulated relatively early in OA development, which might account for the failure to detect angiogenesis-related molecules in the present study in which end-stage OA samples were examined.
Finally, we identified 80 genes but only three of them [POSTN, TNFRSF12 (RANK), and TNFSF11 (RANKL)] were recognized by the IPA. The remainder could play an important role in OA pathology but were not found. Recent gene analysis revealed 117 hub genes in OA subchondral bone27 and 11 of the 80 genes we identified in the present study were included. Among them, only three genes were reported in the literature to have a relationship with OA pathology. The role of the other eight genes in OA development will need further study to understand their role in OA pathology in the subchondral bone.
Limitations
This study has limitations. First, the number of specimens examined was small, but results were consistent with a previous study. Second, we regarded SB from LFC as a normal control, but changes could exist in SB below relatively intact cartilage. Third, contamination of the cartilage sample in the process of sample preparation might exist, but periostin in the OA cartilage was detected primarily in the middle zone of the cartilage and not in the deep zone. Thus, there is a minimum possibility of contamination from cartilage.
Conclusions
Expression levels of 80 genes were found to be altered in severely damaged SB due to OA progression in both the present study and a previous study. Periostin was highly up-regulated and its importance in OA pathogenesis is indicated.
Acknowledgments
This study was funded by Comprehensive Research on Aging and Health, Health and Labor Sciences Research Grants of Japan.
Conflicts of Interest
The authors declare no conflicts of interest relevant to this article.
Informed Consent
Written informed consent was obtained from all the patients.
Ethics Approval
The study was approved by the Ethics Review Board of Chiba University (CM178#597).
References
1: Shapiro LM, McWalter EJ, Son MS, Levenston M, Hargreaves, Gold GE. Mechanisms of Osteoarthritis in the Knee: MR Imaging Appearance. J Magn Reson Imaging 2014; 39: 1346-1356.
2: Barr AJ, Campbell TM, Hopkinson D, Kingsbury SR, Bowes MA, Conaghan PG. A systematic review of the relationship between subchondral bone features, pain and structural pathology in peripheral joint osteoarthritis. Arthritis Res Ther 2015; 17: 228.
3: Suri S, Gill SE, Massena de Camin S, Wilson D, McWilliams DF, Walsh DA. Neurovascular invasion at the osteochondral junction and in osteophytes in osteoarthritis. Ann Rheum Dis 2007; 66: 1423-1428.
4: Shibakawa A, Yudoh K, Masuko-Hongo K, Kato T, Nishioka K, Nakamura H. The role of subchondral bone resorption pits in osteoarthritis: MMP production by cells derived from bone marrow. Osteoarthritis Cartilage 2005; 13: 679-687.
5: Saito M, Sasho T, Yamaguchi S, Ikegawa N, Akagi R, Muramatsu Y, Mukoyama S, Ochiai N, Nakamura J, Nakagawa K, Nakajima A, Yakahashi K. Angiogenic activity of subchondral bone during the progression of osteoarthritis in a rabbit anterior cruciate ligament transection model. Osteoarthritis Cartilage 2012; 12: 1574-1582.
6: Ogino S, Sasho T, Nakagawa K, Suzuki M, Yamaguchi S, Higashi M, Takahashi K, Moriya H. Detection of Pain-related Molecules in the Subchondral Bone of Osteoarthritic Knees. Clin Rheumatol 2009; 28: 1395-1402.
7: Duncan H, Jundt J, Riddle JM, Pitchford W, Christopherson T. The tibial subchondral plate. J Bone Joint Surg 1987; 69A: 1212-1220.
8: Ochiai N, Sasho T, Tahara M, Watanabe A, Matsuki K, Yamaguchi S, Miyake Y, Nakaguchi T, Wada Y, Moriya H. Objective assessments of medial osteoarthritic knee severity by MRI: new computer software to evaluate femoral condyle contours. Int Orthop 2010; 34: 811-817.
9: Chou CH, Wu CC, Song IW, Chuang HP, Lu LS, Chang JH, Kuo SY, Lee CH, Wu JY, Chen YT, Kraus VB, Lee MTM. Genome-wide expression profiles of subchondral bone in osteoarthritis. Arthritis Res Ther 2013; 15: R190.
10: Kellgren JH, Lawrence JS. Radiological assessment of osteo-arthritis. Ann Rheum Dis 1957; 16: 494-501.
11: Loeser RF, Olex AL, McNulty MA, Carlson CS, Callahan MF, Ferguson CM, Chou J, Leng X, Festow JS. Microarray analysis reveals age-related differences in gene expression during the development of osteoarthritis in mice. Arthritis Rheum 2012; 64: 705-17.
12: Attur M, Duan X, Cai L, Han T, Zhang W, Tyksen ED, Samuels J, Brophy R, Abramson SB, Rai MF. Periostin loss-of -function protects mice from post-traumatic and age-related osteoarthritis. Arthritis Res Ther 2021; 23: 104.
13: Jacobs CA, Keller LE, Zhang S, Fu Q, Hunt ER, Stone AV, Conley CEW, Lattermann C, Fortier L. Periostin regulation and cartilage degradation early after anterior cruciate ligament reconstruction. Inflamm Res 2022; doi: 10.1007/s00011-022-01678-9.
14: Ma Z, Zhao X, Deng M, Huang Z, Wang J, Wu Y, Cui D, Liu Y, Liu R, Ouyang G. Bone marrow mesenchymal stromal cell-derived periostin promotes B-all progression by modulating CCL2 in leukemia cells. Cell Rep 2019; 26: 1533-1543.
15: Yoshida S, Nakama T, Ishikawa K, Nakao S, Sonoda K, Ishibashi T. Periostin in vitreoretinal diseases. Cell Mol Life Sci 2017; 74; 4329-4337.
16: Kudo A. Introductory review: periostin—gene and protein structure. Cell Mol Life Sci 2017; 74: 4259-4268.
17: Rosselli-Murai LK, Almeida LO, Zagni C, Galindo-Moreno P, Padial-Molina M, Volk S, Murai MJ, Rios HF, Squarize CH, Castilho RM. Periostin Responds to Mechanical Stress and Tension by Activating the MTOR Signaling Pathway. Plos One 2013; 8: e83580.
18: Zhang M, Ishikawa S, Inagawa T, Ikemoto H, Guo S, Sunagawa M, Hisamitsu T. Influence of mechanical force on bone matrix proteins in ovariectomised mice and osteoblast like MC3T3-E1 cells. In Vivo 2017; 31: 87-95.
19: Bonnet N, Garnero P, Ferrari S. Periostin action in bone. Mol Cell Endocrinol 2016: 432; 75-82.
20: Gerbaix M, Vico L, Ferrari S, Bonnet N. Periostin expression contributes to cortical bone loss during unloading. Bone 2015: 71; 94-100.
21: Chijimatsu R, Kunugiza Y, Taniyama Y, Nakamura N, Tomita T, Yoshikawa H. Expression and pathological effects of periostin in human osteoarthritis cartilage. BMC Musculoskelet Disord 2015; 16: 215.
22: Tat SK, Pelletier JP, Lajeunesse D, Fahmi H, Lavigne M, Martel-Pelletier J. The differential expression of osteoprotegerin (OPG) and receptor activator of nuclear factor κB ligand (RANKL) in human osteoarthritic subchondral bone osteoblasts is an indicator of the metabolic state of these disease cells. Clin Exp Rheumatol 2008; 26: 295-304.
23: Martínez-Calatrava MJ, Prieto-Potín I, Roman-Blas JA, Tardio L, Largo R, Herrero-Beaumont G. RANKL synthesized by articular chondrocytes contributes to juxta-articular bone loss in chronic arthritis. Arthritis Res Ther 2012; 14: R149.
24: Bai S, Zha J, Zhao H, Ross FP, Teitelbaum SL. Tumor Necrosis Factor Receptor-associated Factor 6 is an Intranuclear Transcriptional Coactivator in Osteoclasts. J Biol Chem 2008; 283: 30861-30867.
25: Kim BR, Kwon YW, Park GT, Choi EJ, Seo JK, Jang IH, Kim SC, Ko HC, Lee SC, Kim JH. Identification of a novel angiogenic peptide from periostin. PLoS One 2017; 12: e0187464.
26: Hu K, Olsen BR. Osteoblast-derived VEGF regulates osteoblast differentiation and bone formation during bone repair. J Clin Invest 2016; 126: 509-526.
27: Gu HY, Yang M, Guo J, Zhang C, Lin LL, Liu Y, Wei RX. Identification of the biomarkers and pathological process of osteoarthritis: Weighted gene co-expression network analysis. Front Physiol 2019; 10: 275.
To cite this article
Consistency of differentially expressed genes in the subchondral bone of end-stage osteoarthritic knees
JOINTS 2023;
1: e167
DOI: 10.26355/joints_20234_167
Publication History
Submission date: 01 Mar 2023
Revised on: 10 Mar 2023
Accepted on: 16 Mar 2023
Published online: 16 Mar 2023