JOINTS 2026;
4: e2136
DOI: 10.26355/joints_202607_2136
Performance analysis through GPS data in professional and semi-professional soccer players across a season: a prospective observational study
Topic: Sport Medicine
Category: Original article
Abstract
OBJECTIVE: Soccer teams need players in the best physical and psychological condition. To accurately analyze performance status, new technologies such as GPS have been introduced; however, despite their increasing use, there is still limited scientific literature. This prospective observational study aimed to compare physical performance parameters among professional and semi-professional soccer players competing in different divisions using GPS data.
SUBJECTS AND METHODS: The participants were recruited through soccer clubs in the fourth, third, and second divisions of the Italian Football Federation. The main metrics comprised total and sprint distances covered during the first and second halves across a season.
RESULTS: Data from 20 official matches per player, collected across early (September-October), mid (January-February), and late season (April-May), were analyzed, with each player contributing data from at least 20 full matches. Thirty soccer players were included. Players competing in higher divisions generally covered greater total distance and showed higher sprint activity compared with lower divisions. Overall, the correlation between age and total distance covered was weak and non-significant (ρ = -0.21, p = 0.263). The Kruskal-Wallis test revealed no significant differences in total distance (χ² = 1.245, p = 0.742) or sprint distance (χ² = 3.5, p = 0.321) among playing positions.
CONCLUSIONS: Competitive level was associated with physical performance parameters, with athletes in higher divisions (Serie B and Serie C) covering greater distances and completing more intense sprints than their colleagues in the lower division. Furthermore, performance differences noted between the start and the end of the season within each division highlight the need for a personalized approach to athletic training.
Introduction
Over the last three decades, interest in soccer match analysis has progressively increased, mainly due to the need to objectively quantify players’ physical demands and characterize match-related performance profiles1. Soccer is characterized by dynamic and intermittent physical effort that involves psychological, tactical, technical, and physical factors throughout the game1-4. A single match requires players to repeatedly shift between low- and high-intensity activities, including walking, jogging, running, sprinting, accelerating, decelerating, and changing direction1-4. The physical demands of soccer are complex and vary significantly across positions, tactical systems, and levels of competition. In Italy, soccer holds a remarkably large cultural and economic role, with a highly structured league system that ranges from amateur levels to the top professional tier, Serie A (first division)5. Higher professional divisions, such as Serie B (second division), Serie C (third division), and lower semi-professional Serie D (fourth division), are crucial parts of the development pyramid and provide valuable insights into the physical demands of competitive sport outside the elite context.
Regardless of the division, professional and semi-professional teams require players to maintain optimal physical condition to meet the demands of competitive soccer6. Therefore, adequate physical preparation has become a mandatory part of professional soccer training to address the sport’s physical challenges and counteract injuries (including muscle lesions and anterior cruciate ligament injuries)7-13.
To accurately analyze performance, new technologies have been introduced in recent years, including wearable devices, during both training sessions and matches. Recently, Global Positioning System (GPS) technology has become a fundamental tool for objectively quantifying players’ physical output. GPS systems can accurately capture key performance indicators such as total distance covered, high-speed running distance, number of sprints, and player load14,15. Among these, two of the most widely used and informative metrics are total distance covered and sprint distance (at a speed greater than 25.1 km/h16), both of which are closely linked to match intensity and player fitness levels.
It has recently been shown in the scientific literature that physical performance metrics collected via GPS vary significantly across competitive levels17,18. Soccer players demonstrate different physical profiles according to competitive level, with aerobic capacity, positional behavior, and high-intensity actions representing key factors influencing match performance19,20. For example, comparisons between the second and third divisions have revealed significant differences in both total and sprint distances, reflecting the increasing physical and tactical demands as competition levels rise21. These variations underscore the need to tailor physical training programs not only by playing position but also by competitive level. Despite the increasing use of GPS in professional soccer, there is still limited scientific literature focusing on semi-professional and lower-tier professional divisions, particularly in the Italian football system. Understanding how physical performance varies across different competitive levels can provide valuable insights for coaches, performance analysts, and sports scientists. Such information is vital for bridging the gap between semi-professional and professional standards and for designing effective training plans that mimic the physiological demands of match play at each level.
This prospective observational study aimed to evaluate and compare physical performance parameters (specifically, total distance covered and sprint distance) among players competing in different divisions, according to the player’s role, using GPS data collected during official matches across a season. The study compares both inter-divisional and intra-seasonal performance, in addition to positional analysis. Although multiple matches were analyzed across different phases of the season, and GPS data were collected across multiple matches during the season, all analyses were performed using aggregated player-level performance measures.
Subjects and Methods
Study Design
This prospective observational study was conducted during the 2023/2024 season, specifically, from September 2023 to May 2024, following the guidelines outlined by the Strengthening the Reporting of Observational Studies in Epidemiology (STROBE) guidelines and checklist. The study protocol was approved by the Local Ethics Committee (Università degli Studi del Molise, Italy, protocol code 23/2022, on February 6th, 2023), and the research was conducted in compliance with the Declaration of Helsinki. All participants, or their parents if age < 18 years, provided informed consent before the start of the study.
Participants
The participants were recruited through the contact lists of three soccer clubs in the fourth, third, and second divisions of Italian football, one club from each division, which used the same tactical module, 4-3-3. All teams followed the same standardized physical preparation protocol (FIFA 11+), which was implemented consistently throughout the season. The FIFA 11+ program is recommended by the FIFA research center, and previous studies support its effectiveness10,22-25. It is a structured injury-prevention program developed specifically for soccer players to reduce the risk of lower-limb injuries. The FIFA 11 + program incorporates dynamic warm-ups, neuromuscular control, proprioception, plyometric exercises, and core stability. The level of competition was defined by the Italian Football Federation (FIGC)26. All active soccer players from the participating soccer clubs were eligible to participate in the study. To ensure a representative sample of different divisions and to guarantee consistent and reliable performance, each soccer player included participated in at least 20 full matches of 90 minutes each during the 2023/2024 season. For each athlete, GPS-derived variables were averaged across all eligible matches to obtain season-level performance indicators. These aggregated values were subsequently used for statistical analyses. Specifically, the matches were distributed across three distinct periods: early season (September-October), mid-season (January-February), and late season (April-May). This approach allowed monitoring variations in athlete performance across different times of the season, while accounting for factors such as training load, climatic conditions, and athletes’ physical condition. Goalkeepers were excluded from the analysis. Field players were classified according to their primary playing position as defenders, central midfielders, wingers, or forwards, based on team line-ups and coaching staff indications.
Procedures
Data collected included players’ ages, heights, weights, limb dominance, and playing positions. The main metrics analyzed comprised total distances covered (in km) and sprint distances (in m) during the first and second halves, according to the player’s role.
The total distance covered is considered a general indicator of a player’s work rate and aerobic contribution during a match. It reflects the overall physical engagement but does not discriminate between low- and high-intensity efforts. Elite-level players typically cover distances ranging from 9 to 12 kilometers per match, depending on position and tactical context27. However, this value may vary according to competitive level, as differences in game intensity, pace, and tactical demands can influence the physical output required during matches19. Sprint distance, on the other hand, is a more specific marker of high-intensity effort, often associated with explosive actions that directly influence game outcomes, such as breakaways, defensive recoveries, and goal-scoring opportunities. While sprinting accounts for only about 10% of total distance, it has a disproportionately high impact on match-deciding situations28. In top-tier divisions, players may perform up to 30 sprints per match, with cumulative sprint distances ranging between 250 and 600 meters depending on role and match dynamics29. These figures tend to decline in lower-tier divisions, where sprint frequency and intensity are generally lower30.
GPS data were collected using K-Sport devices (K-50 Wearable Tech, Universal STATS Montelabbate, Pesaro-Urbino, Italy), with a sampling frequency of 10 Hz for positional data and 50 Hz for inertial sensors (accelerometer and gyroscope), integrating the revolutionary Sensor Fusion technology, which also includes a magnetometer and ultra-wideband (UWB). Additionally, using advanced technologies such as Sensor Fusion ensures greater reliability and precision in data collection, providing a solid foundation for subsequent analyses.
GPS data were collected and analyzed to identify any variations in athlete performance. The K-Sport devices used for data collection integrated Sensor Fusion technology, which combined information from various sensors to provide highly detailed data on athlete performance. Additionally, distributing the matches across three seasonal periods enabled the examination of how athlete performance varied throughout the season, offering deeper insights into the factors that influence performance at different stages.
Statistical Analysis
Statistical analysis was performed using Paleontological Statistics (PAST) v. 4.03 (Past4Project, Natural History Museum, University of Oslo, Norway). Data normality was assessed using the Shapiro-Wilk test, which revealed that all variables were non-normally distributed. As a result, only non-parametric methods were applied. To compare distances according to playing position and across divisions, the Kruskal-Wallis test was used. Comparisons of total and sprint distances between first and second halves, between the beginning and end of the season, and between different match phases were conducted using the Wilcoxon signed-rank test for paired data. Spearman’s rank correlation coefficient (ρ) was used to evaluate the relationship between quantitative variables (age, total distance, and sprint distance. Correlation coefficients were interpreted as small (0.10-0.29), moderate (0.30-0.49), and strong (≥ 0.50). All statistical comparisons were performed using player-level aggregated seasonal data, with each player contributing one observation for each analyzed variable. Statistical significance was set at p < 0.05.
Results
A total of 30 soccer players, recruited through the teams in the fourth, third, and second divisions of Italian football, 10 per team, were included in the present study. The athletes were all male, with a mean age of 24.3 ± 5.7 years (range 18-30 years). Most players had a right-dominant limb (83.3%). Regarding playing positions, 11 were defenders (36.6%), 9 were midfielders (30%), 6 were wingers (20%), and 4 were forwards (13.3%). The matches were played on two types of playing surface: natural grass (66.7%) and artificial turf (33.3%). The demographic characteristics, including age, playing position, and limb dominance, of the included subjects are summarized in Table 1.
Table 1. Demographic characteristics of included subjects
| Age | Sex | Division | Role | Dominant limb (R/L) | Total distance (km)
1st half |
Total distance (km) 2nd half | Total distance (km) | Sprint distance (m)
1st half |
Sprint distance (m)
2nd half |
Sprint distance (m) | |
| 1 | 30 | M | Fourth | Defender | R | 4.16 | 3.90 | 8.07 | 194.45 | 184.91 | 379.35 |
| 2 | 30 | M | Fourth | Defender | R | 4.20 | 3.97 | 8.17 | 228.19 | 208.36 | 436.55 |
| 3 | 24 | M | Fourth | Defender | L | 3.99 | 4.05 | 8.04 | 145.36 | 164.63 | 309.99 |
| 4 | 23 | M | Fourth | Defender | R | 4.42 | 3.97 | 8.39 | 234.42 | 172.70 | 407.11 |
| 5 | 20 | M | Fourth | Midfielder | R | 4.33 | 3.79 | 8.12 | 180.50 | 139.71 | 320.21 |
| 6 | 26 | M | Fourth | Midfielder | R | 4.10 | 4.11 | 8.21 | 186.50 | 163.24 | 349.74 |
| 7 | 18 | M | Fourth | Midfielder | R | 4.19 | 3.82 | 8.01 | 174.06 | 132.60 | 306.66 |
| 8 | 19 | M | Fourth | Winger | R-L | 4.34 | 4.06 | 8.40 | 266.20 | 187.47 | 453.67 |
| 9 | 30 | M | Fourth | Winger | R | 4.17 | 4.12 | 8.29 | 243.21 | 223.45 | 466.66 |
| 10 | 30 | M | Fourth | Forward | R | 4.29 | 3.87 | 8.16 | 216.95 | 170.19 | 387.15 |
| 11 | 30 | M | Third | Defender | R | 4.92 | 4.30 | 9.21 | 271.80 | 236.37 | 508.17 |
| 12 | 30 | M | Third | Defender | R | 4.53 | 4.45 | 8.98 | 370.43 | 248.97 | 619.40 |
| 13 | 24 | M | Third | Defender | L | 4.76 | 4.38 | 9.15 | 313.20 | 301.39 | 614.59 |
| 14 | 23 | M | Third | Defender | R | 5.30 | 4.14 | 9.44 | 440.77 | 401.01 | 841.78 |
| 15 | 20 | M | Third | Midfielder | R | 5.26 | 4.77 | 10.03 | 539.51 | 433.38 | 972.88 |
| 16 | 26 | M | Third | Midfielder | R | 4.88 | 4.29 | 9.17 | 485.04 | 347.88 | 832.92 |
| 17 | 18 | M | Third | Midfielder | R | 5.28 | 4.41 | 9.70 | 620.87 | 412.61 | 1,033.48 |
| 18 | 19 | M | Third | Winger | R-L | 4.70 | 4.05 | 8.75 | 489.66 | 358.89 | 848.55 |
| 19 | 30 | M | Third | Winger | R | 5.35 | 4.34 | 9.69 | 611.79 | 439.58 | 1,051.37 |
| 20 | 30 | M | Third | Forward | R | 4.88 | 4.24 | 9.12 | 517.19 | 368.61 | 885.79 |
| 21 | 30 | M | Second | Defender | R | 5.02 | 4.62 | 9.63 | 118.36 | 143.64 | 262.00 |
| 22 | 30 | M | Second | Defender | R | 5.00 | 4.97 | 9.97 | 241.55 | 219.36 | 460.91 |
| 23 | 24 | M | Second | Defender | L | 4.87 | 4.93 | 9.80 | 258.36 | 246.55 | 504.91 |
| 24 | 23 | M | Second | Midfielder | R | 5.13 | 5.04 | 10.17 | 375.45 | 379.82 | 755.27 |
| 25 | 20 | M | Second | Midfielder | R | 5.27 | 5.00 | 10.27 | 302.45 | 288.18 | 590.64 |
| 26 | 26 | M | Second | Midfielder | R | 5.27 | 4.85 | 10.12 | 291.00 | 331.18 | 622.18 |
| 27 | 18 | M | Second | Winger | R | 4.67 | 4.88 | 9.55 | 277.55 | 298.91 | 576.45 |
| 28 | 19 | M | Second | Winger | R-L | 5.33 | 5.26 | 10.59 | 359.55 | 301.09 | 660.64 |
| 29 | 30 | M | Second | Forward | R | 4.88 | 4.64 | 9.52 | 308.45 | 262.91 | 571.36 |
| 30 | 30 | M | Second | Forward | R | 4.89 | 4.88 | 9.77 | 303.55 | 309.55 | 613.09 |
| 24.3 (5.7) | 24R/3L/3R-L | 4.7 (0.43) | 4.40 (0.42) | 9.15 (0.79) | 318.87 (136.05) | 269.23 (93.88) | 588.11 (225.32) |
Data are presented as means (standard deviations). M = male; R = right, L = left.
In the present sample, sprint distance (defined as distance covered at speeds > 25.1 km/h) accounted for approximately 6-7% of the total distance covered during matches.
Temporal comparisons within divisions revealed further insights. In the fourth division, no significant differences were found in total distance between halves at either the start or end of the season, nor between first halves at different times. However, a significant difference emerged in the second half, when comparing the start and end of the season, with a greater distance covered at the end of the season (4.3 ± 0.6 vs. 4.9 ± 0.5 at the start and at the end of the season, respectively, p = 0.03).
For sprint distance, no significant differences were observed across the same comparisons. In the third division, the sprint distance covered in the second half approached statistical significance when comparing the start and end of the season, with greater distance covered at the start of the season (354.8 ± 72.3 vs. 174.7 ± 27.9 at the start and at the end of the season, respectively, p = 0.06). In contrast, sprint performance showed several significant differences: between first halves (661.5 ± 248.8 vs. 402.1 ± 163.2 at the start and at the end of the season, respectively, p = 0.009), second halves (639.9 ± 348.4 vs. 239.2 ± 86.2 at the start and at the end of the season, respectively, p = 0.003) and between first and second halves at the end of the season (402.1 ± 163.2 vs. 239.2 ± 86.2 in the first and second half, respectively, p = 0.01), with fewer distances covered at the end of the season, especially in the second half. In the second division, no significant differences were observed for either total or sprint distances across halves or between different phases of the season.
Finally, inter-division comparisons revealed statistically significant differences in total distance covered between the fourth and third divisions and between the fourth and second divisions in both halves, with higher values observed in the higher divisions (first half 4.2 ± 0.1 vs. 4.9 ± 0.1 in fourth and third divisions, respectively, p = 0.0001; second half 3.9 ± 0.1 vs. 4.3 ± 0.1 in fourth and third divisions, respectively, p = 0.0001); between the fourth and second divisions in both halves (first half 4.2 ± 0.1 vs. 5.0 ± 0.2 in fourth and second divisions, respectively, p = 0.0001; second half 3.9 ± 0.1 vs.4.9 ± 0.1 in fourth and second divisions, respectively, p = 0.0001); and between the third and second divisions only in the second half (4.3 ± 0.2 vs. 4.9 ± 0.1 in third and second divisions, respectively, p = 0.0001). For the sprint distance, significant differences were observed between the fourth and third divisions in the second half (174.7 ± 27.9 vs. 354.8 ± 72.3 in the fourth and third divisions, respectively, p = 0.0001), and between the fourth and second divisions in both halves, with higher sprint distances in the higher divisions (first half 206.9 ± 36.9 vs. 283.62 ± 71.0 in fourth and second divisions, respectively, p = 0.009; second half 174.7 ± 27.9 vs. 278.11 ± 64.9 in fourth and second divisions, respectively, p = 0.0006). Conversely, when comparing the third and second divisions, third-division players covered significantly greater sprint distances in both halves.
Differences between halves in different divisions and inter-division comparisons are summarized in Tables 2 and 3. Moreover, Figure 1 represents total distance and sprint mean inter-division comparisons.
Overall, the correlation between age and total distance covered was weak and non-significant (ρ = -0.21, p = 0.263). Total distance and sprint regression are depicted in Figure 2.
Figure 1. Total distance and sprint mean inter-division comparisons.
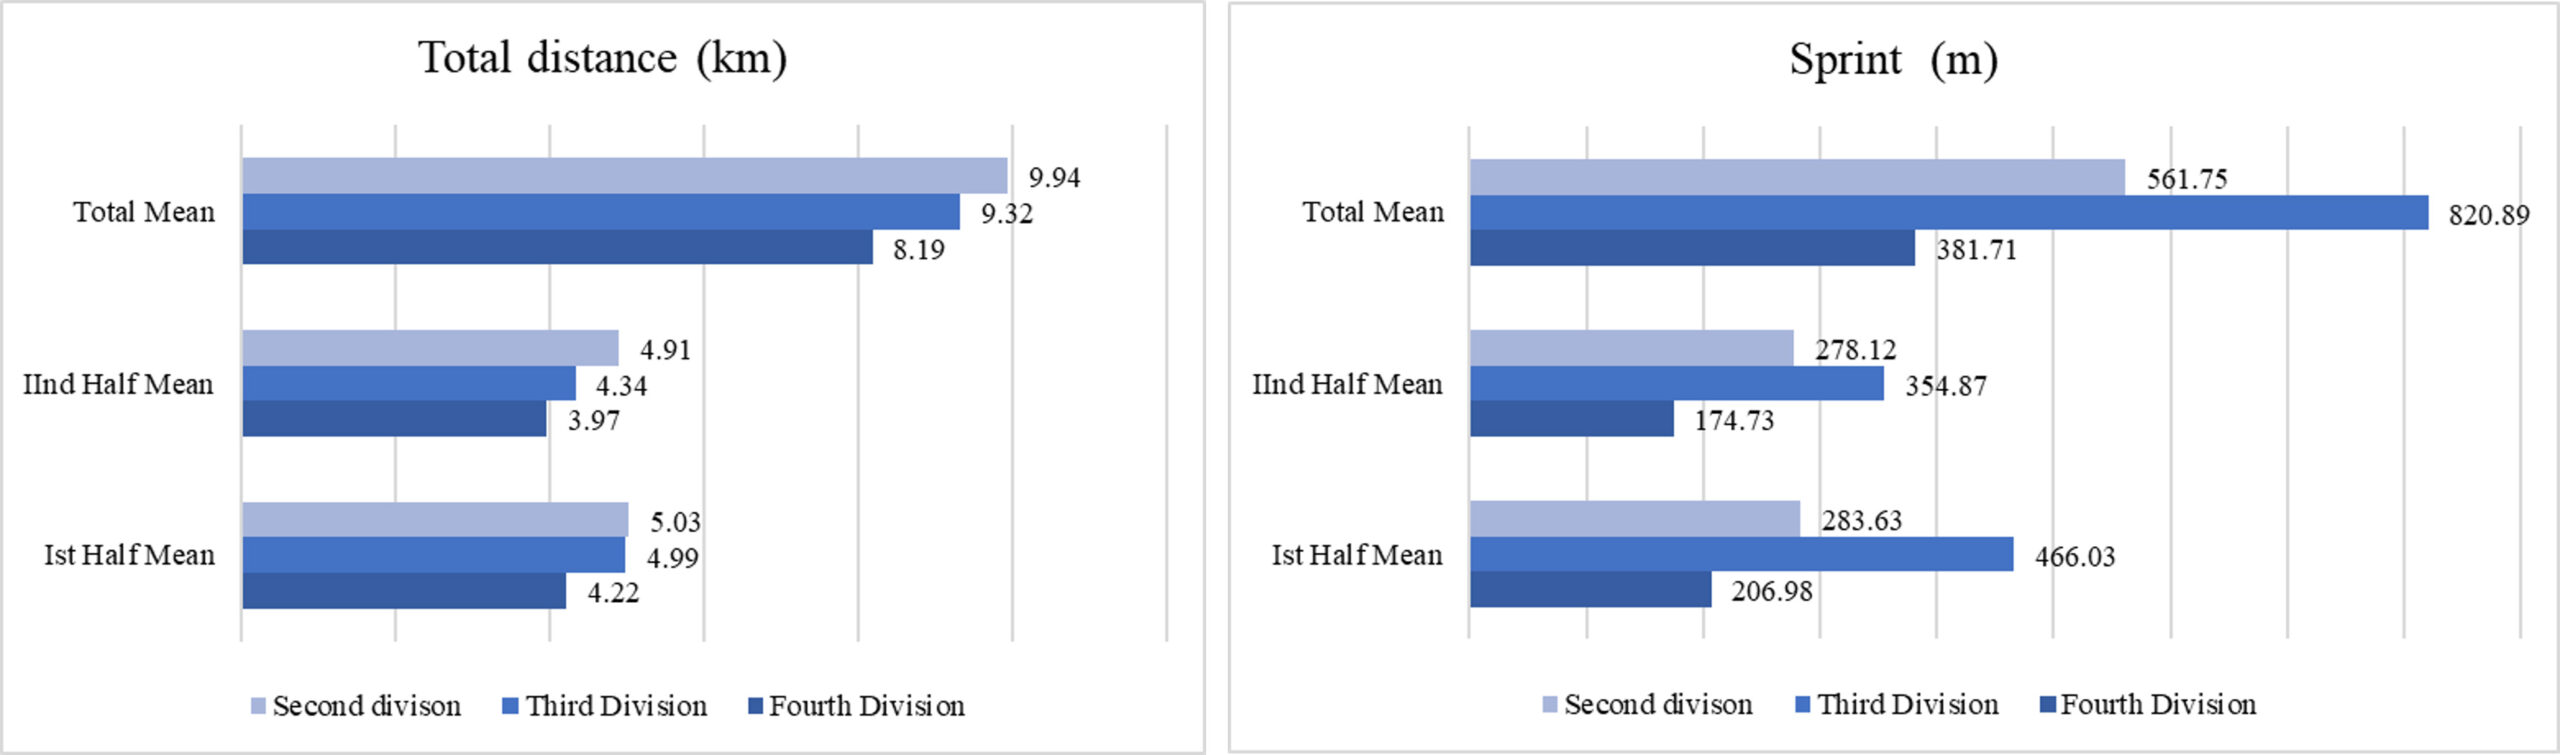
Figure 2. Total distance and sprint regression.
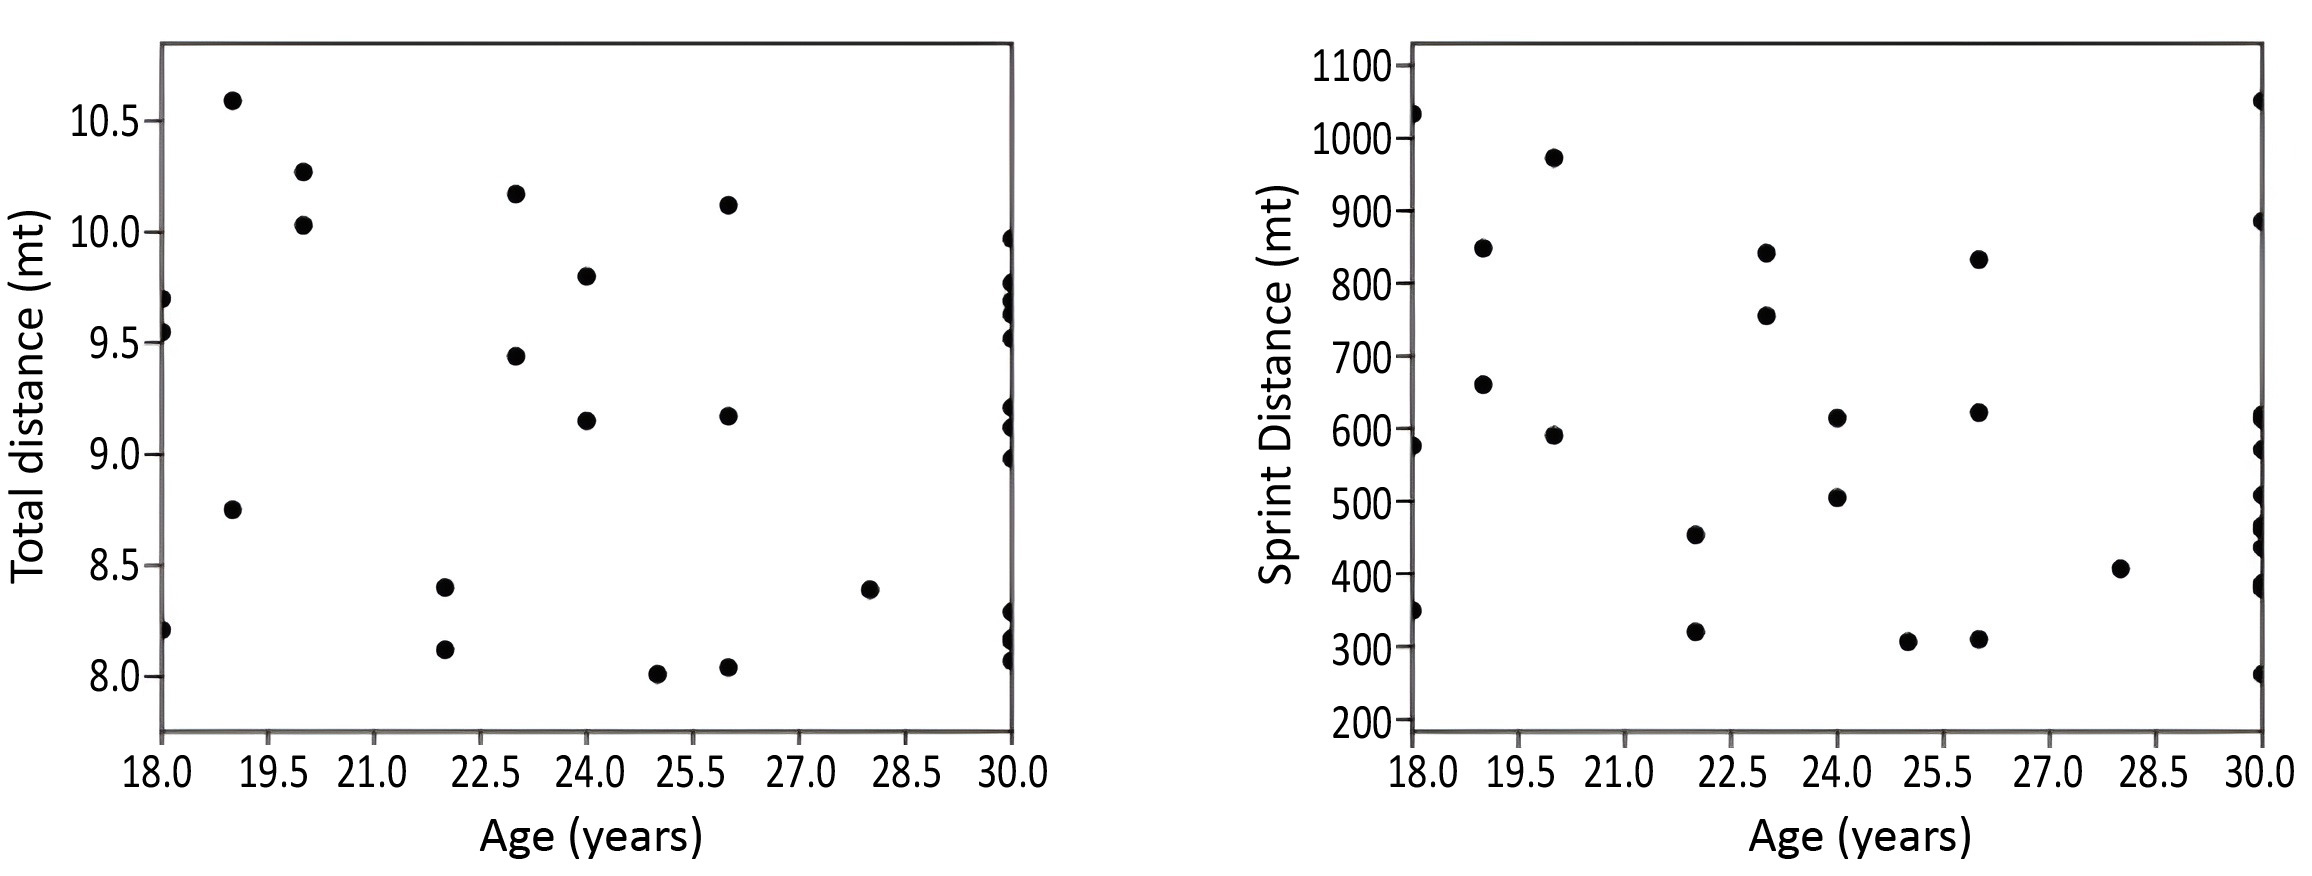
Similarly, the correlation between age and sprint distance was weak and non-significant. Furthermore, the Kruskal-Wallis test revealed no significant differences in total distance (χ² = 1.245, p = 0.742) or sprint distance (χ² = 3.5, p = 0.321) among playing positions (defenders, central midfielders, forwards, wingers) (Tables 4 and 5).
| Fourth division | Third division | Second division | Fourth vs. third
p-value |
Third vs. second
p-value |
Fourth vs. second
p-value |
|
| 1st half | 4.21 (0.12)
|
4.98 (0.29)
|
5.03 (0.21)
|
0.0001* | 0.685 | 0.0001* |
| 2nd half | 3.96 (0.11)
|
4.33 (0.19)
|
4.90 (0.18) | 0.0001* | 0.0001* | 0.0001* |
| p-value | 0.626 | 0.411 | 0.776 | |||
Data are presented as means (standard deviations). *indicates p-value < 0.05.
| Fourth division | Third division | Second division | Fourth vs. third
p-value |
Third vs. second
p-value |
Fourth vs. second
p-value |
||||||
| 1st half | 206.98 (36.94) | 466.02 (177.85) | 283.62 (71.00) | 0.3919 | 0.0009* | 0.009* | |||||
| 2nd half | 174.72 (27.94) | 354.86 (72.39) | 278.11 (64.95) | 0.0001* | 0.02* | 0.0006* | |||||
| p-value | 0.182 | 0.863 | 0.357 | ||||||||
Data are presented as means (standard deviations). *indicates p-value < 0.05.
Table 4. Spearman’s correlation between age and total distance.
| Age | Spearman’s ρ | p-value | Grade of correlation |
| < 20 | -0.57 | 0.4 | Negative, moderate/strong |
| 20-25 | -0.47 | 0.2 | Negative, moderate |
| 26-30 | 0.04 | 0.84 | Positive, very weak |
| Total | -0.21 | 0.2 | Negative, weak |
Table 5. Spearman’s correlation between age and sprint distance.
| Age | Spearman’s ρ | p-value | Grade of correlation |
| < 20 | -0.57 | 0.4 | Negative, moderate/strong |
| 20-25 | -0.33 | 0.37 | Negative, moderate/weak |
| 26-30 | -0.02 | 0.92 | Negative, very weak |
| Total | -0.26 | 0.2 | Negative, weak |
Discussion
This observational study aimed to examine how age, playing position, competition level, and match timing relate to physical performance (total and sprint distance) in soccer players from the fourth, third, and second Italian divisions. While some age-related trends were observed, like a decrease in distance with increasing age among younger groups, none of these correlations were statistically significant. Notably, no relationship emerged in the 25-30 age group, potentially reflecting a plateau of physical performance typical of athletes in early adulthood. At this stage, players generally achieve a balance between peak physiological capacity and tactical experience. The literature31,32 suggests that while sprint capacity may decline slightly with age, decision-making and game-reading skills often compensate for this decline until the early 30s. Similarly, no significant differences were found among playing positions regarding either total or sprint distance, suggesting a relatively even distribution of physical demands across roles in this sample. This may be due to uniform tactical systems or physical preparation routines, though the small sample may limit the detection of finer positional differences.
Previous studies33-36 have reported clear distinctions: midfielders typically cover more distance, while wingers and full-backs engage in more high-speed efforts. For example, Di Salvo et al1 in 2010 analyzed sprint analysis in 147 professional players across UEFA Champions League matches using Prozone tracking, finding that forwards covered 345 ± 129 m in sprint distance, midfielders 313 ± 119 m, and central midfielders only 167 ± 87 m; the average number of sprints was 11.2 ± 5.3 per match. These findings indicate that physical performance profiles differ across competitive levels, although high-intensity output does not increase linearly with division level. In our sample, this variation may have been mitigated by tactical uniformity across teams or limitations in conditioning individualization due to resource constraints. Additionally, the small sample size might have reduced the statistical power to detect position-specific differences.
Within-division temporal comparisons offered more understated insights. In the fourth division, a significant increase in total distance during the second half at the end of the season may reflect improved conditioning or better in-game energy distribution as the season progresses. However, sprint performance in the fourth division remained unchanged over time, suggesting a limited capacity for improvement in high-intensity efforts.
In the third division, changes in both total and sprint distances between the beginning and end of the season suggest a more dynamic physical adaptation, particularly in sprinting, where performance varied significantly both across time and between halves. This highlights the importance of managing and monitoring high-intensity output throughout the season. In contrast, second division players showed no significant changes over time, possibly due to more stable physical conditioning, optimized recovery protocols, and advanced workload management strategies typical of higher-level teams.
The inter-division comparisons revealed that performance metrics (both total and sprint distance) were significantly different across tiers, especially between the fourth division and the higher divisions. The differences in sprint distances were particularly pronounced between the third and second division, and between the fourth and second division, in both halves, highlighting the superior high-intensity output of players in the upper-tier divisions. This finding suggests that high-intensity activity may be influenced not only by competitive level but also by tactical approaches, match dynamics, and team-specific playing styles. This observation confirmed previous research37,38 showing that the intensity of play, frequency of transitions, and tactical demands generally increase with the level of competition. An observational study of Di Salvo et al39 analyzed data from 26.446 observations (from 2006 to 2010) in Premier League vs. Championship, finding that Championship players covered slightly more total distance (~11.1 km) and high-speed/sprint distance than Premier League players (~10.8 km). Similar to our finding of significant inter-division gaps, their conclusions suggested that performance profiles may shift in complex ways at higher levels. In 2019, Sæterbakken et al40 compared professional and semi-professional tiers across Norwegian League levels. While total distance was similar across levels (~10-13 km), sprint distance was markedly higher in top-tier players (by ~28-58%) compared to lower tiers. These results confirmed our findings that total distance may not differ significantly between divisions, but high-intensity metrics do, especially sprint efforts. While total distance generally increased with competitive level, sprint performance did not follow a strictly linear pattern, as third-division players covered longer sprint distances than second-division players. A systematic review41 of sprint thresholds analyzed high-intensity data across professional male players. High-speed distances ranged from 618 to 1,001 m, and sprint distances from 153 to 295 m per match, reinforcing that higher-tier players consistently exhibit greater high-speed and sprint volumes.
Matches in higher leagues are often characterized by quicker ball circulation, higher pressing intensity, and superior physical conditioning, which collectively require players to sustain elevated activity profiles throughout the game. These differences may also reflect structural disparities in Club resources and support. Teams in higher tiers often benefit from advanced sports science services and individualized load management protocols42,43.
Altogether, these findings emphasize the influence of competitive level and seasonal progression on physical performance, particularly sprint capacity. While age and role seem to play a minor role, division level and temporal dynamics affect physical demands, warranting tailored conditioning programs and monitoring strategies for players across divisions. Recently, García-Calvo et al44 studied the evolution of running performance trends in the Spanish First Division vs. the Second Division from 2019 to 2023. First Division players consistently cover more sprint distance than those in the Second Division (+20-50%), confirming that performance escalates with competitive level.
From a practical perspective, these findings highlight the physical gap between league levels and underscore the need to tailor training programs to competitive demands. Coaches working in lower-tier leagues may use these benchmarks to progressively prepare athletes for higher levels by emphasizing repeated sprint ability and endurance under game-specific conditions. Moreover, Rossi et al45 in 2017 developed very accurate predictive models for injury forecasting based on GPS data and machine learning, demonstrating the importance of specific training and high-intensity load management to prevent physiological declines. Although not focused on age, these models confirm how intelligent management of intense activity (e.g., sprint load) can preserve performance even in mature age, thereby contributing to injury prevention through optimized training and recovery planning. GPS-based performance profiles can also aid in player development and talent identification, particularly in contexts where objective performance metrics are used to evaluate readiness for progression to higher competitive levels.
The present study reported several limitations, including the relatively small sample size that might limit the generalizability of the results to the wider soccer population; additionally, no a priori sample size or power calculation was performed. The present study should therefore be considered exploratory, with limited statistical power, particularly for subgroup analyses by playing position and age. Moreover, given the exploratory nature of the analyses, multiple comparisons were performed without formal correction, and this aspect should be considered when interpreting the findings. Only one team per division was included. Consequently, competitive level and team-specific characteristics are partially confounded, and the observed inter-division differences may reflect not only the level of competition but also specific tactical, organizational, or training-related features of the individual teams. Therefore, the present findings should be interpreted with caution and cannot be generalized to all teams within the same competitive level. Although the prospective design allowed monitoring performance variations across different phases of the season, the observational nature of the study precludes causal inference. Also, although GPS technology is widely used and generally considered reliable for tracking physical performance, it remains susceptible to inaccuracies caused by signal loss or environmental conditions. Indeed, GPS-based tracking systems are validated for monitoring external load in team sports, but they are subject to limitations in signal accuracy and consistency, particularly in stadium environments where satellite reception may be partially obstructed. These factors can introduce minor errors in quantifying total distance covered and sprint distance. Additionally, as data were collected exclusively during the official matches, contextual variables (such as match status, tactical strategies, and opponent quality) may have influenced player performance, thereby introducing situational bias. To mitigate measurement bias, all players were monitored using identical GPS units (sampling frequency: 10 Hz) under standardized pre-match calibration protocols. Lastly, we were unable to control for confounding factors, such as shoe type, weather, and field conditions, and the type of artificial turf field, all of which could have influenced the total distance and sprint distance recorded during official matches; also, the lack of complete anthropometric data (height, body mass, and playing experience) may have influenced the results.
Therefore, future studies should adopt longer-term longitudinal and multicenter designs to monitor physical performance over extended periods, ideally across an entire competitive season. Moreover, advancements in wearable technology and real-time tracking systems offer new opportunities to collect richer, multidimensional data. Modern GPS units are increasingly being integrated with inertial measurement units (IMUs), heart rate monitors, and even biochemical sensors, allowing simultaneous tracking of external and internal loads46. These tools could help researchers and practitioners better understand the physiological and biomechanical demands of soccer across different competitive levels.
In this scenario, although the present dataset is limited, future studies with larger samples may benefit from integrating GPS-derived metrics with machine learning approaches to support performance monitoring and injury risk assessment47-50. Predictive models could be developed to estimate injury risk, identify performance plateaus, or personalize training loads based on historical data and contextual match variables51,52. Furthermore, integrating video analysis with positional tracking (e.g., through optical systems or GPS and computer vision) may provide deeper insight into tactical behavior and its relationship with physical output53-55, such as heart rate and lactate, to better characterize match demands across competitive levels. This could allow future research to go beyond isolated physical metrics and explore how physical performance is influenced by game dynamics, team structure, and decision-making. Finally, the increasing accessibility of cloud-based platforms and mobile apps for athlete monitoring allows for large-scale, collaborative databases across clubs and leagues. Such data-sharing initiatives could greatly improve the ecological validity and generalizability of soccer performance research.
Conclusions
Taken together, the findings of the present study provide an analysis of the differences in sports performance between soccer players in the second, third, and fourth divisions of the Italian Football Federation, using GPS data to measure distances covered and sprints performed during official matches.
Moreover, our findings showed that competitive level was associated with physical performance, with athletes competing in higher divisions generally covering greater total distances, whereas sprint performance varied across divisions and did not increase linearly with competitive level.
Furthermore, performance differences noted between the start and the end of the season within each division highlight the need for a personalized approach to athletic training, optimizing athletes’ physical performance according to their competitive level.
Lastly, this study seeks to identify performance trends by player role using GPS data collected during official matches across a season, to inform the development of evidence-based training programs that reflect the real-match demands of each competitive level.
Conflicts of Interest
The authors certify that there is no conflict of interest with any financial organization regarding the material discussed in the manuscript.
Funding
The authors report no sponsor involvement in the research that could have influenced the outcome of this work.
Authors’ Contributions
Michele Mercurio, Alessandro Imbrogno, and Lucrezia Moggio have given substantial contributions to the conception, the design of the manuscript, and the data acquisition. Umile Giuseppe Longo and Simone Cerciello contributed primarily to the analysis and interpretation of the data. All authors have participated in drafting the manuscript; Alessandro de Sire, Antonio Ammendolia, Olimpio Galasso, and Giorgio Gasparini revised it critically. All authors read and approved the final version of the manuscript.
Informed Consent
Written informed consent was obtained from all participants before their inclusion in the study. For participants under 18 years of age, informed consent was obtained from their parents or legal guardians.
Ethics Approval
The study protocol was approved by the Local Ethics Committee (Università degli Studi del Molise, Italy, protocol code 23/2022, on February 6th, 2023), and the research was conducted in compliance with the Declaration of Helsinki.
Availability of Data and Materials
The datasets generated and/or analyzed during the current study are available from the corresponding author on reasonable request.
AI Disclosure
The authors declare that no generative artificial intelligence was used in this manuscript. The AI tool was not used to generate scientific content, analyze data, or draw conclusions. All scientific interpretations and final responsibility for the content of the manuscript remain with the authors.
References
- Di Salvo V, Baron R, González-Haro C, Gormasz C, Pigozzi F, Bachl N. Sprinting analysis of elite soccer players during European Champions League and UEFA Cup matches. J Sports Sci 2010; 28: 1489-1494.
- Vigne G, Gaudino C, Rogowski I, Alloatti G, Hautier C. Activity profile in elite Italian soccer team. Int J Sports Med 2010; 31: 304-310.
- Rivilla-García J, Calvo LC, Jiménez-Rubio S, Paredes-Hernández V, Muñoz A, van den Tillaar R, Navandar A. Characteristics of Very High Intensity Runs of Soccer Players in Relation to their Playing Position and Playing Half in the 2013-14 Spanish La Liga Season. J Hum Kinet 2019; 66: 213-222.
- Milanović Z, Sporiš G, James N, Trajković N, Ignjatović A, Sarmento H, Trecroci A, Mendes BMB. Physiological Demands, Morphological Characteristics, Physical Abilities and Injuries of Female Soccer Players. J Hum Kinet 2017; 60: 77-83.
- FIGC. ReportCalcio 2023. Federazione Italiana Giuoco Calcio 2023. Available at: https://www.figc.it/media/uploads/federazione/trasparenza/FIGC-ReportCalcio2023_ENG_BD.pdf
- Dolci F, Hart NH, Kilding A, Chivers P, Piggott B, Spiteri T. Movement Economy in Soccer: Current Data and Limitations. Sports (Basel) 2018; 6: 124.
- Mercurio M, Corona K, Galasso O, Cerciello S, Morris BJ, Guerra G, Gasparini G. Soccer players show the highest seasonal groin pain prevalence and the longest time loss from sport among 500 athletes from major team sports. Knee Surg Sports Traumatol Arthrosc 2022; 30: 2149-2157.
- Mercurio M, Cofano E, Gasparini G, Galasso O, Familiari F, Sanzo V, Ciolli G, Corona K, Cerciello S. Isolated ACL Reconstruction Versus Combined ACL and Anterolateral Ligament Reconstruction: Functional Outcomes, Return to Sport, and Survivorship: An Updated Meta-analysis of Comparative Studies. Am J Sports Med 2025; 53: 971-980.
- Longo UG, Sofi F, Candela V, Risi Ambrogioni L, Pagliai G, Massaroni C, Schena E, Cimmino M, D’Ancona F, Denaro V. The influence of athletic performance on the highest positions of the final ranking during 2017/2018 Serie A season. BMC Sports Sci Med Rehabil 2021; 13: 32.
- Mercurio M, Carlisi G, Ostojic M, Imbrogno A, Galasso O, Gasparini G. The Protective Role of the FIFA 11+ Training Program on the Valgus Loading of the Knee in Academy Soccer Players Across a Season. Healthcare (Basel) 2025; 13: 73.
- de Sire A, Demeco A, Marotta N, Moggio L, Palumbo A, Iona T, Ammendolia A. Anterior Cruciate Ligament Injury Prevention Exercises: Could a Neuromuscular Warm-Up Improve Muscle Pre-Activation before a Soccer Game? A Proof-of-Principle Study on Professional Football Players. Appl Sci 2021; 11: 11.
- Marotta N, de Sire A, Calafiore D, Agostini F, Lippi L, Curci C, Ferraro F, Bernetti A, Invernizzi M, Ammendolia A.Impact of COVID-19 Era on the Anterior Cruciate Ligament Injury Rehabilitation: A Scoping Review. J Clin Med 2023; 12: 17.
- Marotta N, de Sire A, Gimigliano A, Demeco A, Moggio L, Vescio A, Iona T, Ammendolia A. Impact of COVID-19 lockdown on the epidemiology of soccer muscle injuries in Italian Serie A professional football players. J Sports Med Phys Fitness 2022; 62: 356-360.
- Buchheit M, Simpson BM. Player-Tracking Technology: Half-Full or Half-Empty Glass? Int J Sports Physiol Perform 2017; 12: S235-S241.
- Cummins C, Orr R, O’Connor H, West C. Global positioning systems (GPS) and microtechnology sensors in team sports: a systematic review. Sports Med 2013; 43: 1025-1042.
- Reynolds J, Connor M, Jamil M, Beato M. Quantifying and Comparing the Match Demands of U18, U23, and 1ST Team English Professional Soccer Players. Front Physiol 2021; 12: 706451.
- Zandavalli LA, Grazioli R, Izquierdo M, Garcia-Tabar I, Veeck F, Setuain I, Ramirez GS, Aroni AL, Pinto RS, Cadore EL. Physical Performance Changes in Season are Associated with GPS Data in Soccer Players. Int J Sports Med 2024; 45: 1047-1054.
- Kobal R, Carvalho L, Jacob R, Rossetti M, de Paula Oliveira L, Do Carmo EC, et al. Comparison among U-17, U-20, and Professional Female Soccer in the GPS Profiles during Brazilian Championships. Int J Environ Res Public Health 2022; 19: 16642.
- Gabbett TJ, Whiteley R. Two Training-Load Paradoxes: Can We Work Harder and Smarter, Can Physical Preparation and Medical Be Teammates? Int J Sports Physiol Perform 2017; 12: S250-S254.
- Andrzejewski M, Chmura J, Pluta B, Strzelczyk R, Kasprzak A. Analysis of sprinting activities of professional soccer players. J Strength Cond Res 2013; 27: 2134-2140.
- Borghi S, Colombo D, La Torre A, Banfi G, Bonato M, Vitale JA. Differences in GPS variables according to playing formations and playing positions in U19 male soccer players. Res Sports Med 2021; 29:225-239.
- Bizzini M, Dvorak J. FIFA 11+: an effective programme to prevent football injuries in various player groups worldwide—a narrative review. Br J Sports Med 2015; 49: 577-579.
- Caudet Sánchez P, Baiget E, Batalla Gavalda A, Colomar J, Corbi F. Acute effects of the FIFA 11+ warm up protocol on distal mechanical and physiological tissue properties and performance in male and female soccer players. Phys Sportsmed 2026; 1-9.
- Vlachas T, Paraskevopoulos E. The Effect of the FIFA 11+ on Injury Prevention and Performance in Football: A Systematic Review with Meta-Analysis. BioMed 2022; 2: 328-340.
- Kambitta Valappil IN, Govindasamy K, Vasanthi G, Elayaraja M, Clark CCT, Parpa K, Katanic B, Uysal HŞ, Zouhal H, Granacher U. Effects of the FIFA 11+ Program on Physical Fitness in Youth and Adult Soccer Players: A Systematic Review and Meta-analysis. Sports Med 2026; 56: 521-541.
- FIGC. Federazione Italiana Giuoco Calcio.
- Di Salvo V, Gregson W, Atkinson G, Tordoff P, Drust B. Analysis of high intensity activity in Premier League soccer. Int J Sports Med 2009; 30: 205-212.
- Faude O, Koch T, Meyer T. Straight sprinting is the most frequent action in goal situations in professional football. J Sports Sci 2012; 30: 625-631.
- Bradley PS, Carling C, Gomez Diaz A, Hood P, Barnes C, Ade J, Boddy M, Krustrup P, Mohr M. Match performance and physical capacity of players in the top three competitive standards of English professional soccer. Hum Mov Sci 2013; 32: 808-821.
- Pillitteri G, Giustino V, Messina G, Petrucci M, Rossi A, Bellafiore M, et al. Comparison of external load indicators between official matches and sport-specific training in semi-professional soccer players: focus on intensity and strength. J Sports Med Phys Fitness 2023; 63: 385-393.
- Hicheur H, Chauvin A, Chassot S, Chenevière X, Taube W. Effects of age on the soccer-specific cognitive-motor performance of elite young soccer players: Comparison between objective measurements and coaches’ evaluation. PLoS One 2017; 12: e0185460.
- Dambroz F, Teoldo I. Better decision-making skills support tactical behaviour and reduce physical wear under physical fatigue in soccer. Front Physiol 2023; 14: 1116924.
- Bradley PS, Sheldon W, Wooster B, Olsen P, Boanas P, Krustrup P. High-intensity running in English FA Premier League soccer matches. J Sports Sci 2009; 27: 159-168.
- Chmura P, Konefał M, Chmura J, Kowalczuk E, Zając T, Rokita A, Andrzejewski M. Match outcome and running performance in different intensity ranges among elite soccer players. Biol Sport 2018; 35: 197-203.
- Baptista I, Johansen D, Seabra A, Pettersen SA. Position specific player load during match-play in a professional football club. PLoS One 2018; 13: e0198115.
- Altmann S, Forcher L, Ruf L, Beavan A, Groß T, Lussi P, Woll A, Härtel S. Match-related physical performance in professional soccer: Position or player specific? PLoS One 2021; 16: e0256695.
- Thoseby B, Govus AD, Clarke AC, Middleton KJ, Dascombe BJ. Peak match acceleration demands differentiate between elite youth and professional football players. PLoS One 2023; 18: e0277901.
- Morgans R, Bezuglov E, Orme P, Burns K, Rhodes D, Babraj J, Di Michele R, Oliveira RFS. The Physical Demands of Match-Play in Academy and Senior Soccer Players from the Scottish Premiership. Sports (Basel) 2022; 10: 150.
- Di Salvo V, Pigozzi F, González-Haro C, Laughlin MS, De Witt JK. Match performance comparison in top English soccer leagues. Int J Sports Med 2013; 34: 526-532.
- Sæterbakken A, Haug V, Fransson D, Grendstad HN, Gundersen HS, Moe VF, Ylvisaker E, Shaw M, Riiser A, Andersen V. Match Running Performance on Three Different Competitive Standards in Norwegian Soccer. Sports Med Int Open 2019; 3: E82-E88.
- Gualtieri A, Rampinini E, Dello Iacono A, Beato M. High-speed running and sprinting in professional adult soccer: Current thresholds definition, match demands and training strategies. A systematic review. Front Sports Act Living 2023; 5: 1116293.
- Armitage M, McErlain-Naylor SA, Devereux G, Beato M, Buckthorpe M. On-field rehabilitation in football: Current knowledge, applications and future directions. Front Sports Act Living 2022; 4: 970152.
- West SW, Clubb J, Torres-Ronda L, Howells D, Leng E, Vescovi JD, Carmody S, Posthumus M, Dalen-Lorentsen T, Windt J. More than a Metric: How Training Load is Used in Elite Sport for Athlete Management. Int J Sports Med 2021; 42: 300-306.
- García-Calvo T, Lobo-Triviño D, Raya-González J, López Del Campo R, Resta R, Pons E, Ponce-Bordón JC. The Evolution of Match Running Performance in the Top Two Spanish Soccer Leagues: A Comparative Four-Season Study. J Funct Morphol Kinesiol 2025; 10: 27.
- Rossi A, Pappalardo L, Cintia P, Iaia FM, Fernández J, Medina D. Effective injury forecasting in soccer with GPS training data and machine learning. PLoS One 2018; 13: e0201264.
- Theodoropoulos JS, Bettle J, Kosy JD. The use of GPS and inertial devices for player monitoring in team sports: A review of current and future applications. Orthop Rev (Pavia) 2020; 12: 7863.
- Elstak I, Salmon P, McLean S. Artificial intelligence applications in the football codes: A systematic review. J Sports Sci 2024; 42: 1184-1199.
- Rico-González M, Pino-Ortega J, Méndez A, Clemente FM, Baca A. Machine learning application in soccer: a systematic review. Biol Sport 2023; 40: 249-263.
- Piłka T, Grzelak B, Sadurska A, Górecki T, Dyczkowski K. Predicting Injuries in Football Based on Data Collected from GPS-Based Wearable Sensors. Sensors (Basel) 2023; 23: 1227.
- Mercurio M, Denami F, Melissaridou D, Corona K, Cerciello S, Laganà D, Gasparini G; IORS; Minici R. Deep Learning Models to Detect Anterior Cruciate Ligament Injury on MRI: A Comprehensive Review. Diagnostics (Basel) 2025; 15: 776.
- Van Eetvelde H, Mendonça LD, Ley C, Seil R, Tischer T. Machine learning methods in sport injury prediction and prevention: a systematic review. J Exp Orthop 2021; 8: 27.
- Majumdar A, Bakirov R, Hodges D, Scott S, Rees T. Machine Learning for Understanding and Predicting Injuries in Football. Sports Med Open 2022; 8: 73.
- Altmann S, Forcher L, Ruf L, Beavan A, Groß T, Lussi P, Woll A, Härtel S. Match-related physical performance in professional soccer: Position or player specific? PLoS One 2021; 16: e0256695.
- Teixeira JE, Forte P, Ferraz R, Branquinho L, Silva AJ, Monteiro AM, Barbosa TM. Integrating physical and tactical factors in football using positional data: a systematic review. PeerJ 2022; 10: e14381.
- Ferraz A, Duarte-Mendes P, Sarmento H, Valente-Dos-Santos J, Travassos B. Tracking devices and physical performance analysis in team sports: a comprehensive framework for research—trends and future directions. Front Sports Act Living 2023; 5: 1284086.
To cite this article
Performance analysis through GPS data in professional and semi-professional soccer players across a season: a prospective observational study
JOINTS 2026;
4: e2136
DOI: 10.26355/joints_202607_2136
Publication History
Submission date: 10 Sep 2025
Revised on: 12 Dec 2025
Accepted on: 13 May 2026
Published online: 10 Jul 2026